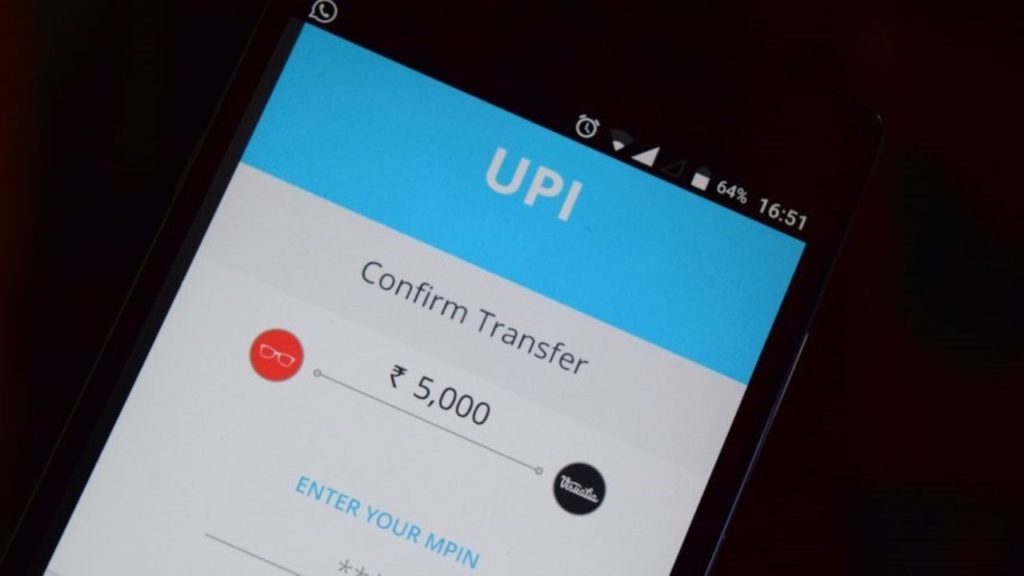
UPI Captures 10% Of All Retail Payments In India! Grows 400% In Last 4 Years

The Unified Payments Interface (UPI) performance in the country has been on a spiralling roll. Introduced only in 2016, the instant real-time payment system has climbed up the payments chain in India and now marks a make up of 10% of all retail payments.
In addition to the increase in transaction volume, the value of payments conducted through UPI has also shown unprecedented figures in FY21.
This value is reported to be at Rs 41 lakh crore, which surpasses the payment values conducted via credit and debit cards at POS terminals.
Trak.in had posted details about the exemplary performance of UPI marked in June 2021, when the transaction volume had boomed up after dropping consecutively for two immediately preceding months.
UPI Surpasses Card Payments in FY2021
According to a report by Macquarie Research, UPI constitutes 10% of all retail payments in India in 2021.
The value of payments too, have been going on at Rs 41 lakh crore, which is almost 2.8 times more than that made by credit and debit cards at point-of-sale terminals.
Besides UPI, IMPS, NEFT, and mobile wallets are other platforms of payments that are widely being used.
Also, UPI’s value of payments’ share comes out to be 20 times that of payments conducted via prepaid instruments and wallets, while the latter constitutes a little less than 0.5% of overall retail payments.
For the report analysis, Macquarie Research did not include the real time gross settlement (RTGS) mode, while defining the boundaries for retail payments.
This is because while RTGS is essentially the backbone of the payment system, it is preferably used to conduct larger value transfers and payments.
“While the retail payments (by value) have delivered an 18% compounded annual growth rate over FY15-FY21, UPI has grown at CAGR of 400% over FY17-21 and now forms 10% of overall retail payments (excluding RTGS) from 2% seen couple of years ago,” mentions the report.
Card Payments Preferred For Higher-Value Transaction
Macquarie has found out that when it comes to higher ticket sizes, more people prefer making transactions via cards, as opposed to small ticket purchases, where UPI payments prevail.
Most payments done using UPI are peer-to-peer transfers.
The report adds, “While peer-to-merchant transactions form 45% of the total UPI transactions by volume, in value terms they constitute just 19% with average ticket size of Rs700 for FY21.”
The average ticket size in the peer-to-peer segment has been Rs 2,700 compared to credit card average transaction size of Rs3,600 at point-of-sale terminals, adds Bloomberg.
In June 2021, the UPI transaction value amounted to Rs 5,04,886.44 crore, which increased to a total of Rs 6.06 lakh crore in July 2021.
PhonePe dominated the UPI ecosystem in May, with 45.27% market share, followed by Google Pay with 34.67% and Paytm with 11.44% market share.
July 2021 too, witnesses the same trend, however with increasing magnitudes and numbers.
PhonePe now makes up 86% of the market share, while Google Pay climbs up to a close second, making up 80% of the share. Paytm is a distant third 8% market share by value and 12% by volume.

Comments are closed, but trackbacks and pingbacks are open.