App Stats: Indians Are 5th Biggest User Base of Apps; Globally 1 Trillion Hours Of App Usage Recorded In 2016

App Annie, one of the leading providers of mobile app analytics and insights reported a massive increase in application usage, globally.
While 1 trillion hours of global app usage has been recorded by them in 2016, India has emerged as the 5th biggest user base of mobile apps, all over the world.
As per App Annie, 94 out of top 100 digital publishers use services by them, and this report and analysis have been created based on their in-house analytics and records.
The report observes that mobile applications have now become an integral part of mobile users’ lives, and more and more users are now relying on apps for every basic life activity.
The fact that India has beaten countries in USA, UK and Germany in monthly app usage time clearly points to the digital revolution which India is experiencing right now, aided by Jio’s telecom disruption and the introduction of cheaper data tariffs, across all spectrum.
Some major highlights from the report:
Contents [hide]
How Many Apps Are Used By An Average User/Day?
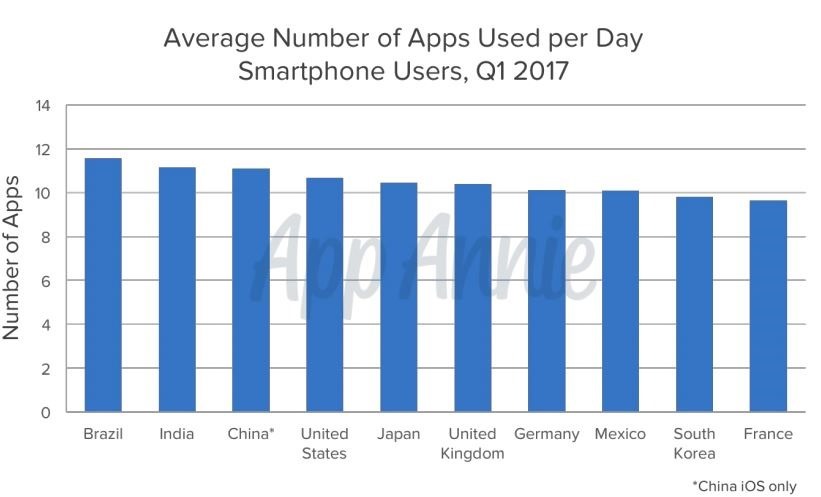
As per the findings of the report, an average user anywhere in the world uses an average of at least 9 apps/ day. In China, a typical user will use 11 apps per day, and WeChat is one of them.

Which OS Users Use Most Apps?
Apple users have clearly beaten Android in terms of app usage. The report finds that patrons of iOS are the heaviest users of apps.
Which Countries Lead App Usage?
Brazil, China and India are the world’s three top users of apps, based on monthly usage patterns.
How Much Time is Spent on Apps?
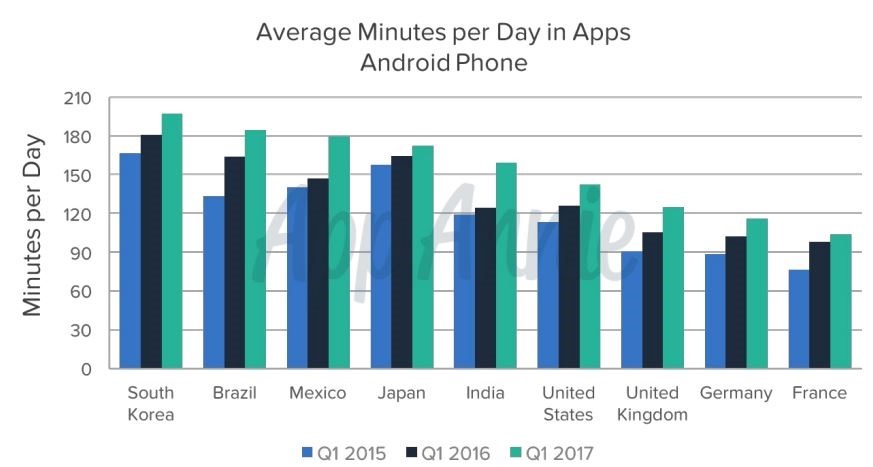
In terms of time spend on apps, Indians are ranked $5 in the world. South Korean users are the #1 in spending time on apps, which is around 200 minutes a day. In India, an average user is spending 155 minutes per day on Apps.

The top 5 countries in app usage/day are South Korea; Brazil; Mexico; Japan and India.
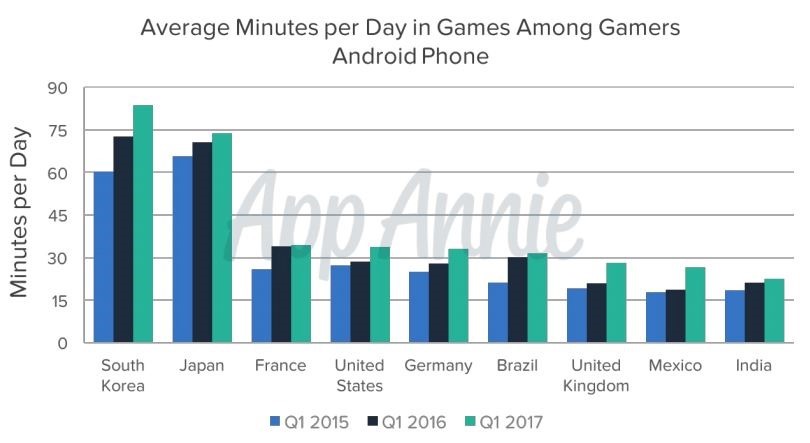
Interestingly, games consume 25% of all app usage time for users from South Korea and Japan.
Monthly App Usage Pattern
The report finds that 30 apps are used per month, by a typical user, anywhere in the world. And, 30 is somewhere between one-third and half of all apps found in a typical users’ smartphone. The report says, “User retention and re-engagement remain key to any app strategy..”
Which Category of Apps Are Heavily Used?
The report finds that Utility and Tool Apps are the most heavily used, but at the same breath, the report also says that due to default loading of these apps in Android and iOS based smartphones, these Utility and Tool apps have garnered lion’s share.
Social Media apps are the most widely used apps if we remove Utility and Tools from the equation. Then come Games and News apps.
Which Users Play Most Game Apps?
Android users have been found to be spending 30% more time in playing gaming apps, compared to iOS users. But, in terms of gaming revenues, Apple beats Android.

Which Category Attracts Maximum Avg Session/day?
In 2017, dating and productivity apps consumed maximum time, for each average session, per day. This means, once a user is logged into dating or productivity apps, then they spent an average of 4 minutes of these apps per session, which is highest.
Finance and Productivity app users spent 1 minute per session.
The report says, “The variation between categories in time and sessions per day means that there is no one-size-fits-all app strategy: It is important to define KPIs based on your app’s specific use case, in addition to aligning your engagement strategy and your app itself around user behaviour.”
You can find the complete report here.

The survey seeems to be right.. 30 apps are used per month.. any smartphone user do that..
Informative article about mobile app usage statistics. Thanks!!