Mobile Shopping Trends: 106% Growth, Sunday Most Popular, Friday Least
It is an established fact that more and more people are now shopping online, assisted by their smartphones. A report by Opera goes on to reveal how consumers are using their mobile phones to do so. It studies consumer behavior while making online purchases, breaking down mobile shopping trends by time of year, days of the week and geography, and showcasing the top mobile sites and advertisers of this holiday season.
? “Online shopping has become a major force in global markets. And, with the holiday shopping season upon us in the United States, we see mobile’s share of that market accelerating,” says Larry Moores, Vice President for Consumer Mobile Reporting and Analytics at Opera Software.
Mobile Shoppers Most Active on Sundays, Least Active on Fridays
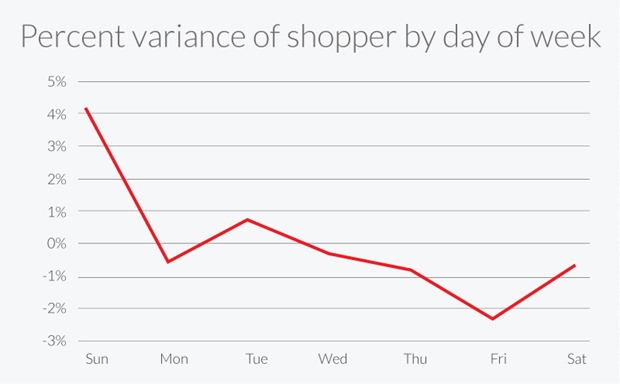
While traffic from desktops and laptops to online shopping portals peaks on Mondays and records heavier flow during the course of the week, online shopping through mobiles was very much the reverse of this. Mobile shoppers were seen to be most active on Sundays.

The day with the lowest mobile shopping traffic is Friday.
One possible explanation is that many consumers use their mobile devices to browse products over the weekend, then revisit and purchase when they return to their desks on Monday.
In India, Saturdays and Sundays are the most popular days to shop with a decline on Mondays and through mid-week. The decline however is very marginal as Indians enjoy a shopping spree throughout the week.
October Sees Highest Volume of Traffic to Mobile Shopping Sites in India, While In Europe and America, It Is During Christmas Season
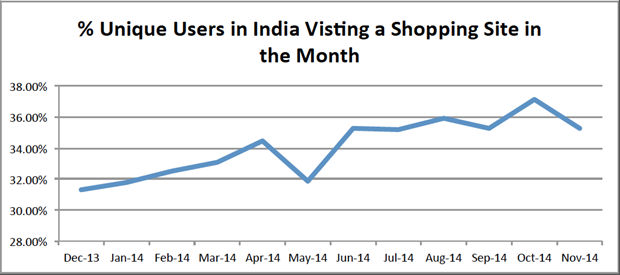
Shopping in India is at its peak during the month of October. In keeping with the same, the market for online mobile shopping has also grown significantly over the last year.

As we close 2014 we expect that over 35% of mobile users will now be actively shopping with their mobile devices.
Interaction of Indians with mobile shopping sites (measured by page views) is also growing impressively. Over the last one year, it has more than doubled, growing by over 106%.
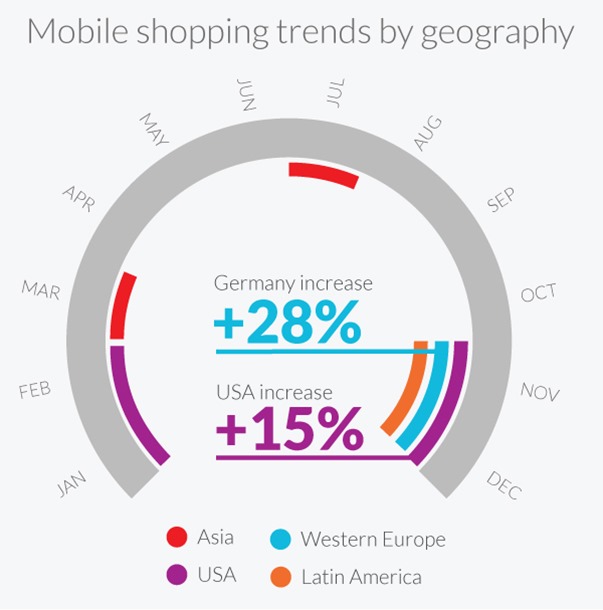
In the rest of Asia, however, March is the peak month for volume, followed closely by July. This is largely due to Ramadan starting in late June and ending in late July this year.

As expected, the Christmas season is the most active time for shopping in Europe, the United States and Latin America.
Western Europe has a noticeably strong preference for shopping during November and December. Germany in particular shows a large increase in the number of shoppers during this period, experiencing an increase of over 28% in the number of mobile shoppers from its annual average.
True to the cliché`- In India, the winner takes it all: Flipkart on top though Amazon Catching Up Fast
Flipkart is the leading online retailer in India. It is the undisputed market leader, followed closely by Amazon and Snapdeal. Though a latecomer on the Indian scene, Amazon has grown in India at a tremendous rate and already dented the Flipkart monopoly.

On the global level, there is no questioning Amazon’s iron grip over the online retail market though there are some regional market leaders like Alibaba in China, Berniaga in Indonesia and MercadoLibre in Latin America.
Top Advertiser Categories
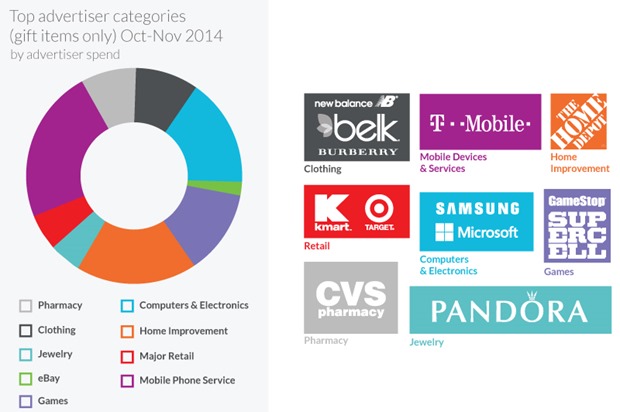
A greater percentage of impressions on the mobile ad platform (in the months of October and November) came from ad campaigns for games, followed by computers and electronics. But the top spenders were mobile phone services, followed closely by home improvement stores. Jewellery and apparel showed up several notches lower on the list.
The brands which spent the most on advertising within each category are also mentioned:

The findings of this report are based on anonymous sources, compiled from the aggregated data of 270 million users of Opera software’s mobile browsers and Opera Mediaworks mobile ad platform, which serves 65 billion ad impressions a month on over 17,500 mobile sites and apps and reaches 800 million consumers globally.

Thanks for sharing insights for Purchase trends
But i think now booming market has changed the Mobile Purchased Graph