Online Display Advertising Landscape In India: ComScore [Infographic]
India is a developing economy with increasing buying power for its citizens. Along with the penetration of technology deep inside India, its not just smartphones or laptops making inroads – there is an entire ecosystem flourishing. And advertisements are fast jumping from television to the online medium. Lets have a look at the changing landscape of Indian online ads.
Analytics giant ComScore’s report interprets that a young and upwardly mobile population with growing income levels and increasing online penetration makes India a very lucrative online market. In line with this trend online advertising has seen a very healthy growth pattern in the last few years.
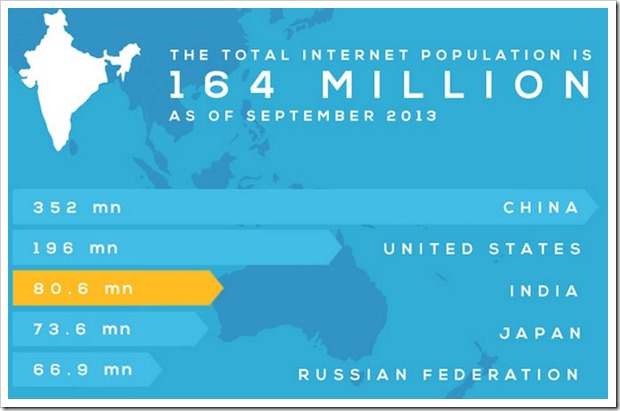
Alone in the last quarter, more than 96 billion ad impressions were delivered across India’s websites. Of course it would be, considering the total Indian internet population is 164 million, just behind China (352 million) and USA (196 million), as of Sept 2013.

Here are some of the key highlights of the report:
- More than 3900 advertisers ran online ad campaign campaigns in Sep 2013
- On an average, each online Indian was exposed to more than 395 ads in the last month
- Social Media and Portals continue to get the highest ad impressions
Contents
Data trends of ad categories
Out of the four major categories where total impressions of all advertisers of that category was calculated, Retail industry led the charts in September with nearly 4 billion impressions, Finance with 1.19 billion, Automotive with 705 million and Consumer Goods with 559 million.
Top advertisers

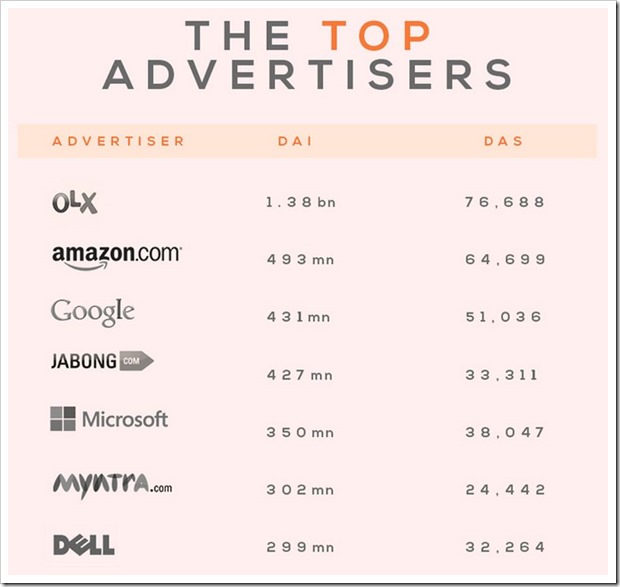
Surprisingly, OLX led the pack with a mind-boggling 1.38 billion Display Ad Impressions (DAI) compared to 493 million of Amazon.com, 431 million of Google and Jabong, Microsoft, Myntra and Dell behind it.
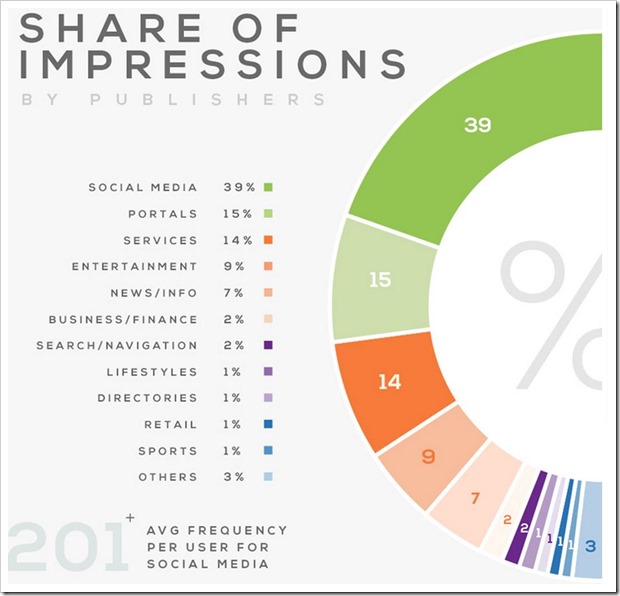
Social media led with 39%, portals with 15% and services with 14%, entertainment, news and business following closely –meaning the average frequency of impressions per user for social media was 201!
In short, when you open Facebook the next time and see an ad on the right hand side, do take it that even this is counted.

All this led to 30.2 billion ads being served just in September 2013 with 380 crore INR of advertising impressions which meant average frequency per user was more than 395!
Demographic vs ad reach
As commonly believed, the maximum number of ads were shown to the age group of 15-24 years, then 25-34 years and then 35-44 years and so on.
Display Advertising Sizes
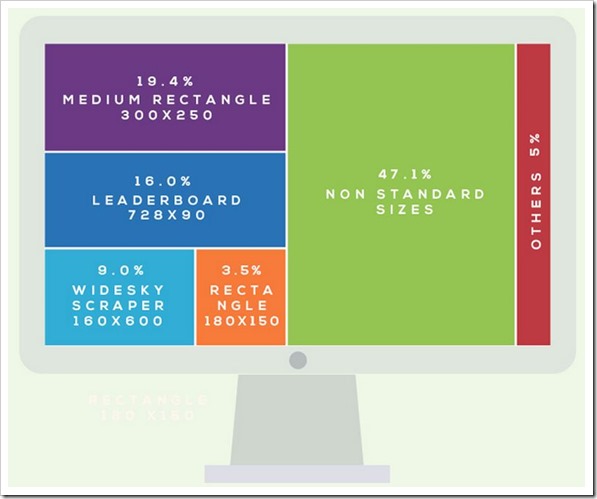
Nearly half of the ads shown were in non-standard sizes. Around a fifth of them were medium rectangle 300X250 (width X height) and around 16% of leaderboard size (728X90)

And this is just the beginning! Don’t be surprised if you are bombarded with ads more and more in every step of your life!
[Check out entire Infographic here]

Hey Amit.. These are some super helpful stats and bring things into perspective. Look forward to following your posts..