The National Sample Survey Office [NSSO] and Ministry of Statistics and Programme Implementation recently released some of the key indicators of household consumer expenditure in India and it makes for some interesting reading.
The NSSO survey, in it’s 68th edition, aims at generating estimates of household monthly per capita expenditure (MPCE) and the findings based on the data collected between July 2011–June 2012. The sample for data collection was spread across 7,469 villages in rural areas and 5,268 urban blocks spread all across India.
Key Findings
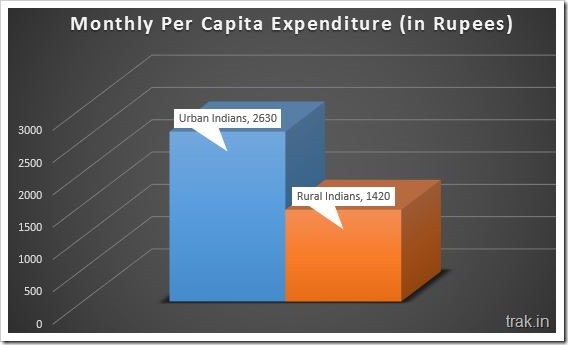
Monthly expenditure of Rural Indians was estimated to be at Rs. 1430, as compared to Rs. 2630 for urban Indians, which means Urban Indians spend nearly 84 percent more money every month on average as compared to Rural Indians.

There was also a wide variance within Rural India – Only about 10 percent of the rural population reported household monthly per capita expenditure above Rs.2296 while only 5% reported MPCE above Rs.2886.
On the other hand, when it came to urban centres in India, 10 percent reported household monthly per capita expenditure over Rs.4610 while 5 percent reported MPCE above Rs.6383.
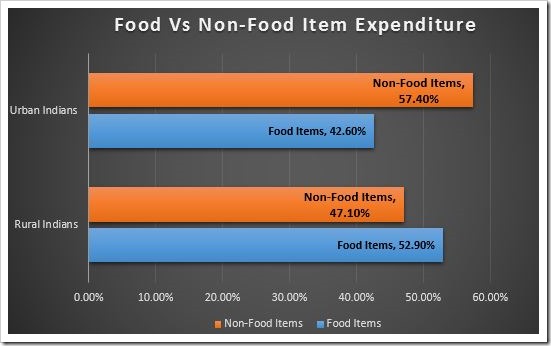
It is interesting to note that rural Indians spend much more on food compared to non-food items. For an average rural Indian, food accounted for 52.9% of their overall expenditure, which included 10.8 percent for cereals and cereal substitutes, 8 percent for milk and milk products, 7.9 percent on beverages, refreshments and processed food, and 6.6 percent on vegetables.
Among the non-food items, rural Indians spent about 8 percent on Fuel / Light, 7 percent on Clothing & Footwear, 6.7 percent as medical expenses , 3.5 percent on Education, 4.2 percent on conveyance and 8.5 percent on consumer services and durables.

Urban Indian spends much less amount on Food with only 42.6 percent accounting for food items. Break-up of food items included 9 percent for beverages, refreshments and processed food,
7 percent for milk and milk products, and 6.7percent for cereals and cereal substitutes.
Among the non-food items for Urban Indians Education accounted for 6.9 percent, 6.7 percent for fuel and light, 6.5 percent for conveyance and clothing/footwear for 6.4%.
Here is the full pdf of report released by National Sample Survey Office:
